Still related to my previous post, this post is a written summary from [1] - which talks about k-means clustering. Understanding k-means will be relevant to complement k-nearest neighbours (knn), since it also considers distance between data points.
Clustering
On supervised learning (e.g. knn, decision tree), we already know what we are going to predict (target class $y$), such as whether tomorrow will be raining or not. On the contrary, just like its name, unsupervised learning algorithms attempt to find pattern from the data - without knowing the labels (target class $y$). One of unsupervised algorithms is clustering. It can be used for various things:
- searching for subpopulations on the data
- finding similarity of each subpopulations
- detecting outliers
Types of clustering
Based on goal
- Monothetic
- cluster members have some common properties, e.g. when a cluster contains males aged 25-30 years old
- Polythetic
- cluster members are similar to each other, but we can’t state what similar means
- similarity is measured based on distance between each data point
Based on overlap types
- hard clustering: clusters don’t overlap
- each element only belongs to one cluster
- soft clustering: clusters may overlap
- cluster membership is based on strength of association between a data point and a cluster
Based on structure
- flat clustering: flat grouping of elements into groups, e.g. dog, cat, chicken, duck
- hierarchical clustering: each cluster can form a subgroup, e.g. mammal = {dog, cat}; bird = {chicken, duck}
Clustering methods
Example of clustering methods:
- k-d trees
- monothetic, hard boundaries, hierarchical
- also can be used to speed up knn computation
- k-means clustering
- splits data into $k$ number of clusters
- polythetic, hard boundaries, flat
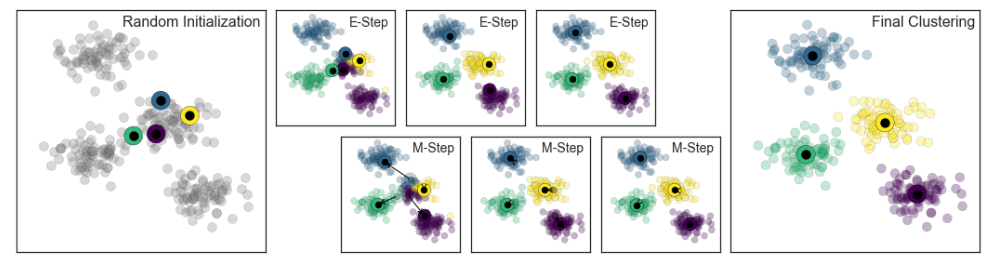
- Gaussian mixture model (Expectation-Maximization algorithm)
- polythetic, soft boundaries, flat
- Agglomerative clustering
- polythetic, hard boundaries, hierarchical
On this post, we’ll focus on k-means algorithm.
k-means algorithm
How does it work?
Given a set of input $x_i, …, x_n$ and $k$ number of clusters:
- place centroids $c_i, …, c_k$ at random locations
- repeat these steps until convergence:
- for each point $x_i$:
- find the nearest centroid $c_j$ by calculating the distance between $x_i$ and $c_j$
- assign point $x_i$ to cluster $c_j$
- for each cluster $j=1…k$:
- update centroid = mean of all points $x_i$ which are assigned to centroid $c_j$ in the previous step
- for each point $x_i$:
Note:
- the input attributes for k-means must be numeric
- we stop step 2 when none of the cluster assignment changes
Compared to other clustering algorithms, k-means is considered fast, with complexity O(# of iterations * # of clusters * # of instances * # of dimensions).
Properties of k-means:
- minimize aggregate intra-cluster distance $V = \sum_{j}\sum_{x_i \rightarrow c_j}{D(c_j, x_i)^2}$
- converges to local minimum:
- different starting points end up in different results
- to avoid this, we could run k-means several times with random starting points. Then, we use results which have smallest aggregate intra-cluster distance
- nearby data points could end up in different cluster, depends on the initialization of centroid
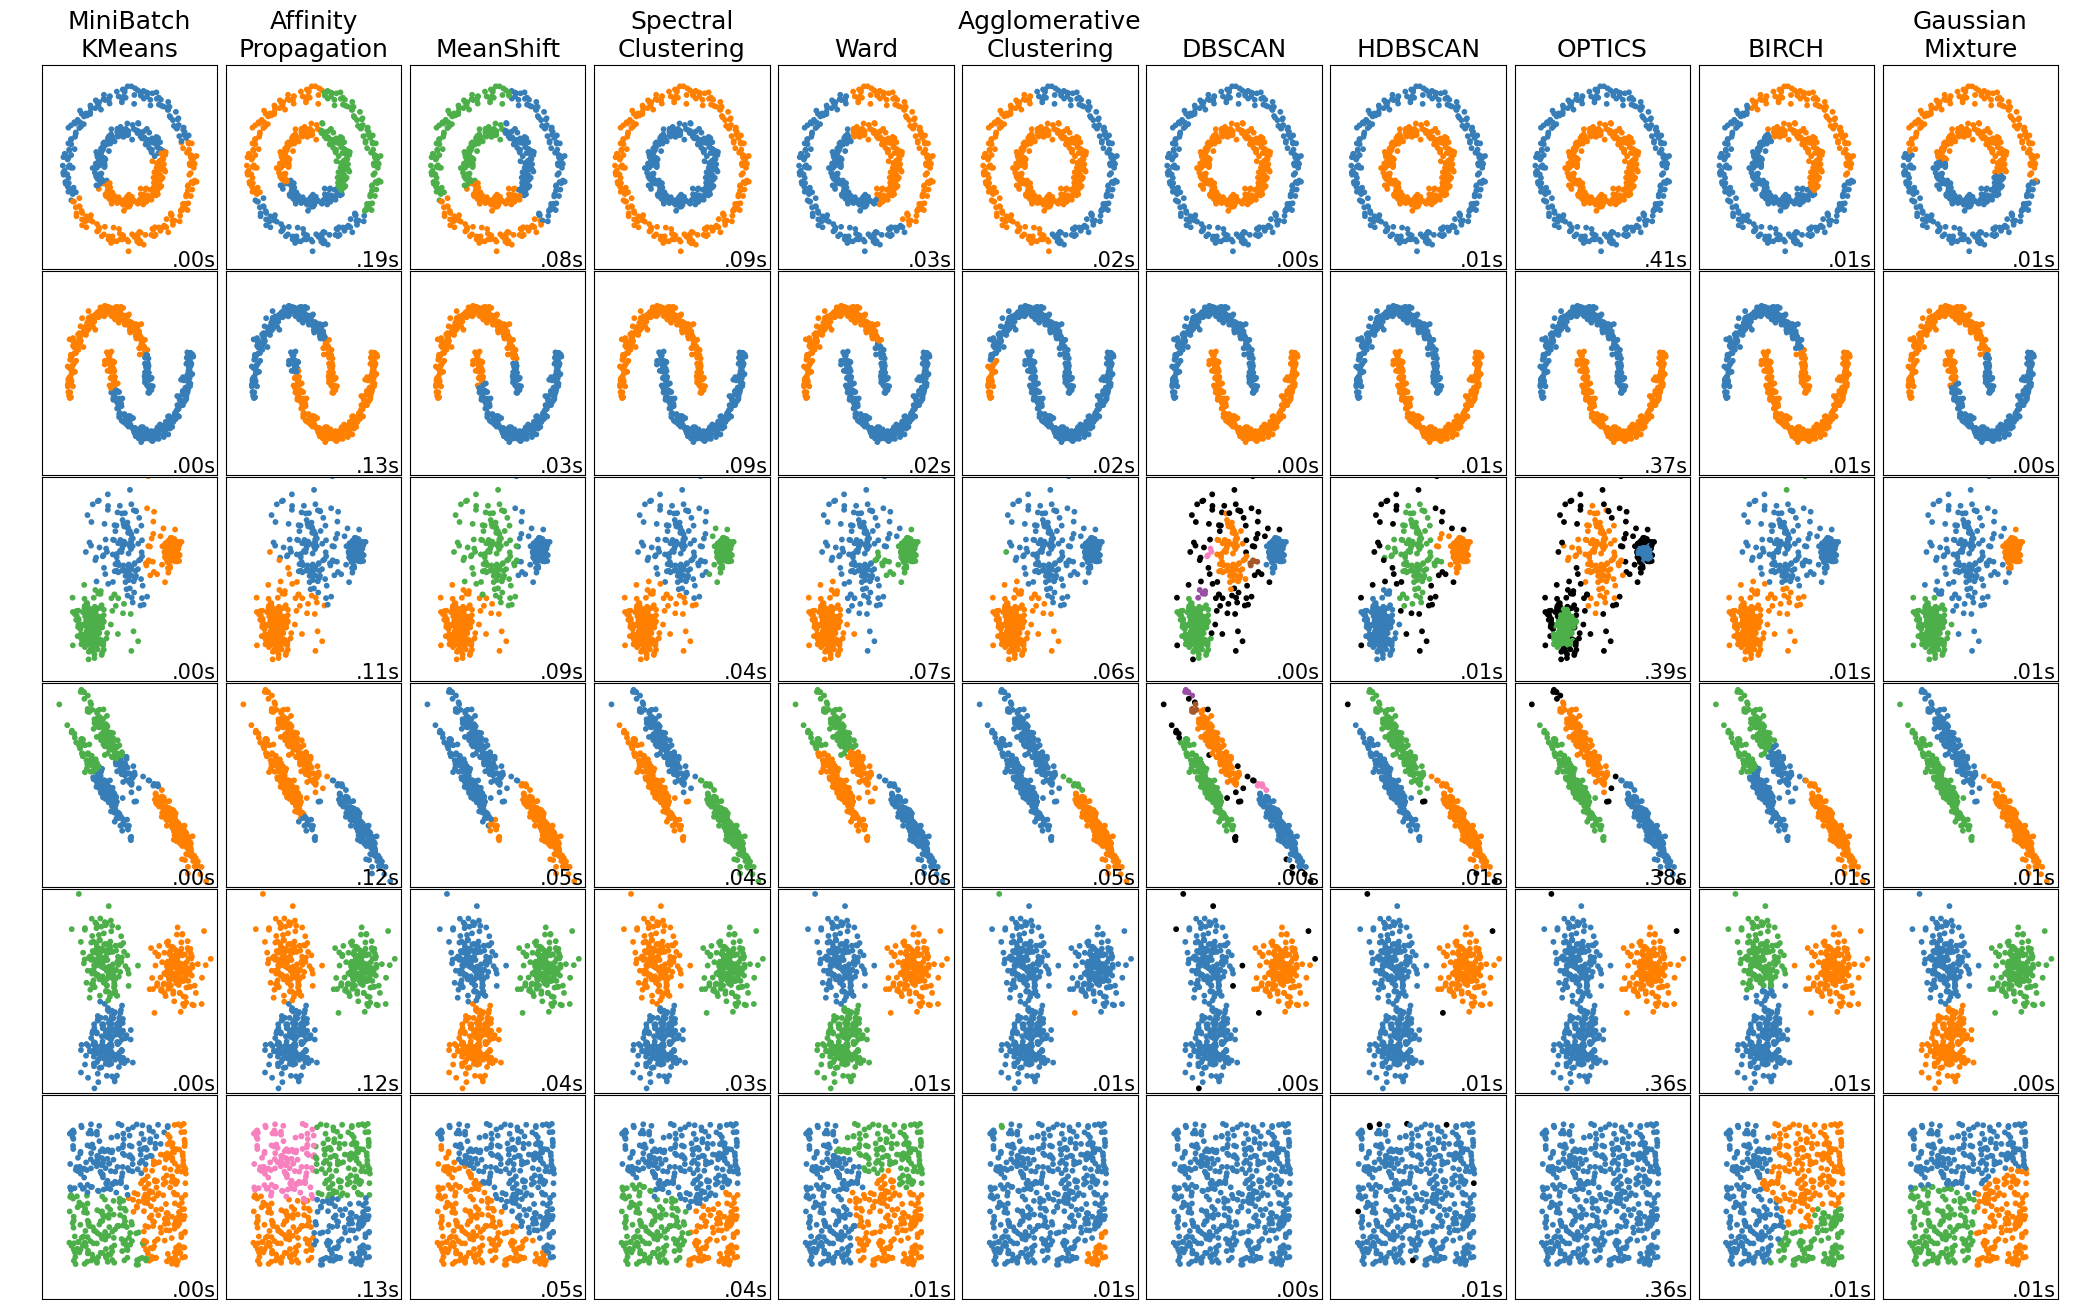
- limited to linear cluster boundaries
How to choose number of $k$?
If you already have an initial assumption of your dataset, e.g. the data are image of 0 to 9, then you can use $k=10$. If you don’t, you can choose $k$ which has the smallest aggregate intra-cluster distance: run k-means multiple times with different $k$ on each runs, calculate $V$. However, this approach means $k=n$ will result in the smallest $V$. It is similar to using $k=1$ on knn - the model will overfit.
We could use Scree plot to decide the value of $k$:
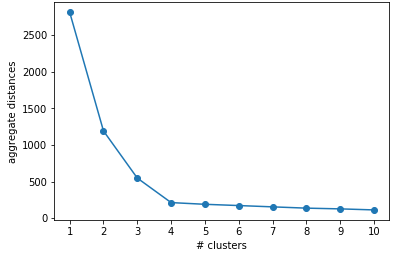
Based on elbow method, we could pick $k$ where the aggregate intra-cluster distance has highest rate of decrease (has optimum 2nd derivative value of $V$) - you can observe the visualizaton using Scree plot. On Figure 4, we could pick $k$ = 4.
How to evaluate clustering results?
Clustering algorithm doesn’t have objective way to measure goodness of clustering result, which is different to supervised algorithm - we already know what the target class is. Thus, there are two approaches to evaluate the result:
- instrinsic evaluation
- explore cluster characteristics using descriptive analysis
- if the clusters correspond to the class (e.g. MNIST dataset), align the clustering result to the class labels
- compare sample of clustering result with human evaluation
- extrinsic evaluation
- this approach is used when our goal is to use clustering results on other tasks, e.g. as additional feature on classification algorithm, to identify outliers
Intrinsic evaluation
1. Align clustering result with class labels
This can be performed only if we have the ground truth (reference class) of the data points, and if the clusters correspond to the classes (e.g. MNIST dataset). Given clusters $C_1, C_2, …, C_K$ and reference classes $R_1, R_2, …, R_N$, we align $R_i$ with $C_j$, then calculate its accuracy or F-1 score.
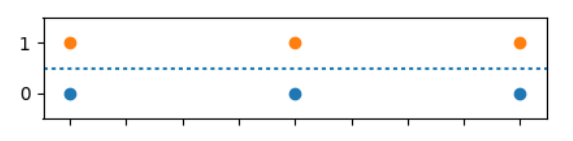
2. Pair-matching
Since we can’t ask human to cluster huge data points manually, we only can ask them to evaluate whether sample pair $x_i, x_j$ should be in the same group or not. For example, human evaluation results:
- $a, b$ = same group
- $c, d$ = different group
- $e, h$ = same group
- $g, h$ = different group
We evaluate that evaluation to the clustering results:
- $C_1 = {a,b,c,d,g}$
- $C_2 = {e,f,i,k}$
- $C_3 = {h,j,l}$
Then, we count the error, accuracy, and F1-score.
- False negatives: matching pairs $x_i, x_j$ which aren’t in the same cluster –> ($e, h$)
- False positives: non-matching pairs $x_i, x_j$ which are in the same cluster –> ($c, d$)
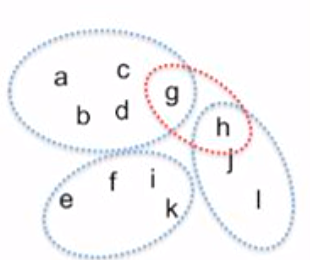
If the clustering algorithm allows overlapping cluster (see red boundary on Figure 5), we could handle it by counting (g, h) as both true negative (it is not on the same cluster: $C_1$ and $C_3$), and also as false positive (it should be on the new cluster in the red boundary).
Extrinsic evaluation
Sample application:
- Dimensionality reduction: instead of using each pixels in an image, we can split the pixels into patches, cluster those patches and use the clusters as feature to classify the image
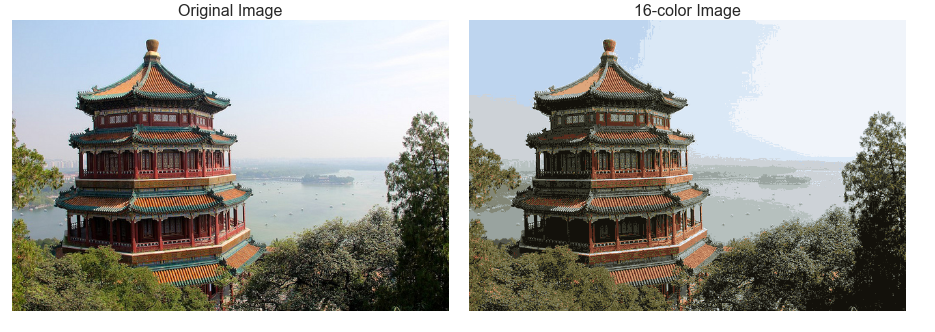
- Image compression [3]: use cluster centers to represent pixel space of an image
Conclusions
From explanations above, we already understand variety of clustering algorithms: based on its goal, cluster membership, and also cluster structure. While it can be used to observe the underlying subpopulation within the dataset, there is no objective way to evaluate goodness of clustering results. We might require human evaluation, or use the clustering results on other task to find out its usefulness.
k-means clustering is a fast clustering algorithm which could work on huge dataset. Prior to using it, we should determine value of $k$ and distance measure to use; and also check out whether the dataset shape is linearly-separable or not.
References
[1] Victor Lavrenko - k-means Clustering
[2] Ali Akbar Septiandri - Data Mining Course
[3] Jake VanderPlas - Python Data Science Handbook
[4] Devert Alexandre - University of Science and Technology of China